
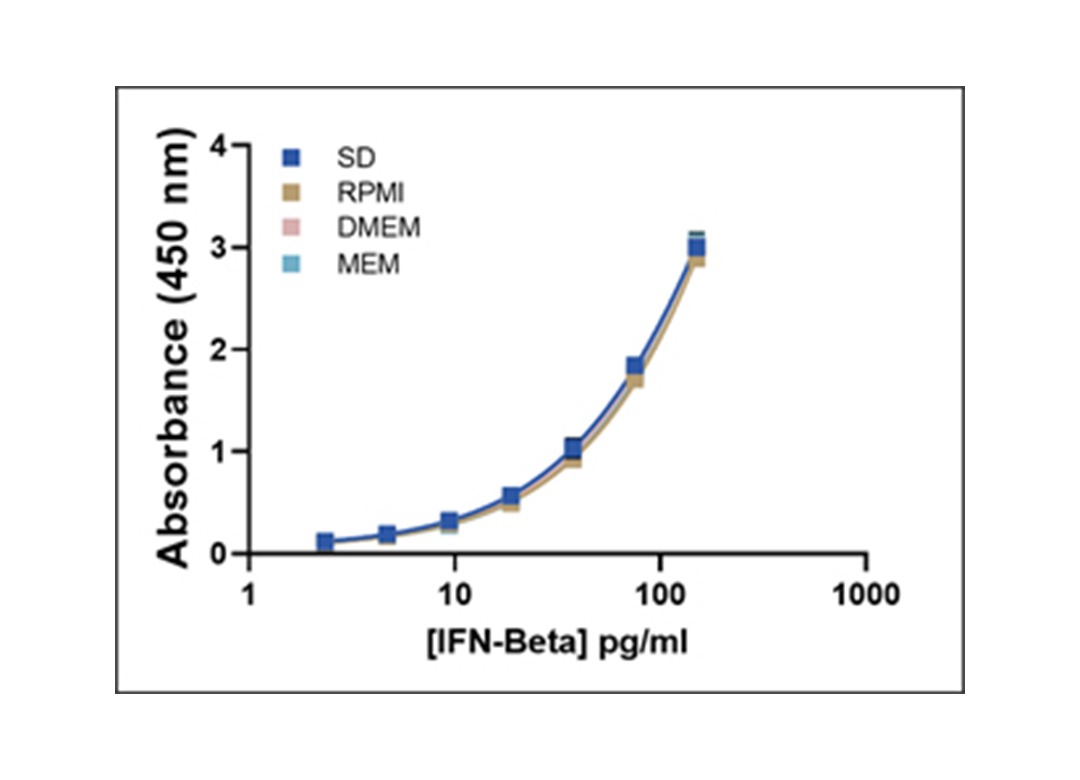
<p>Representative Human IFN-Beta Standard Curves in Various Matrices (see Technical Data Sheet)</p>

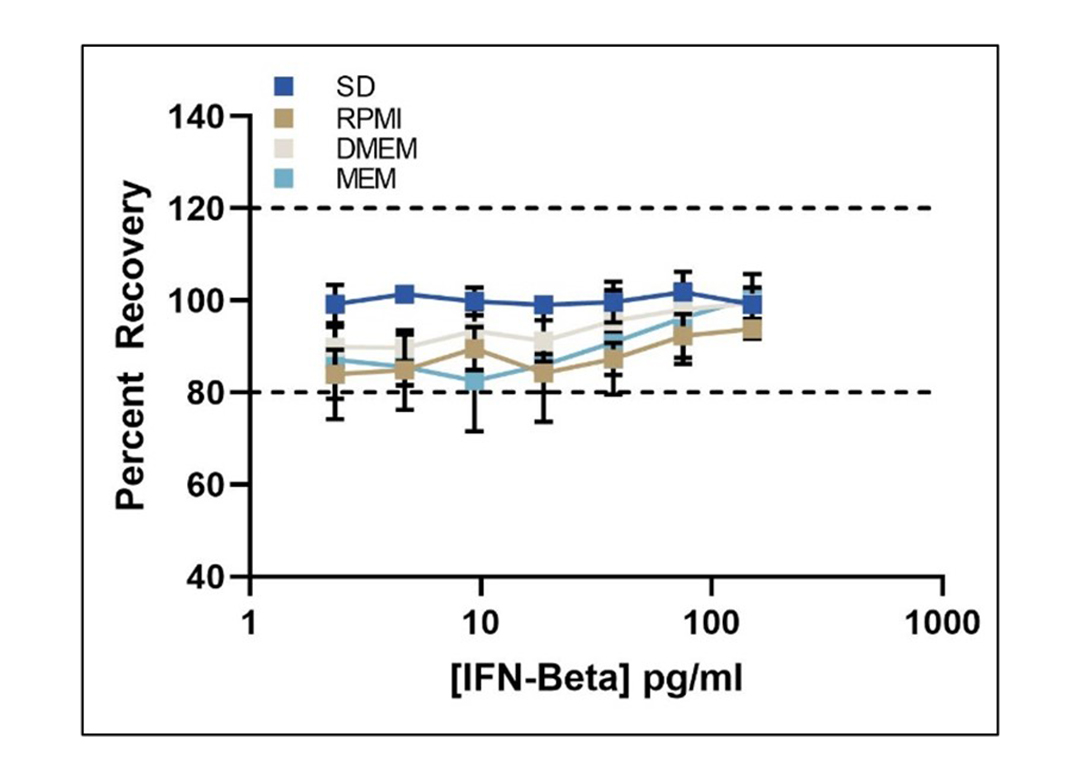
<p>Matrix Compliance of Standard Diluent and Three Different TCMs (see Technical Data Sheet)</p>

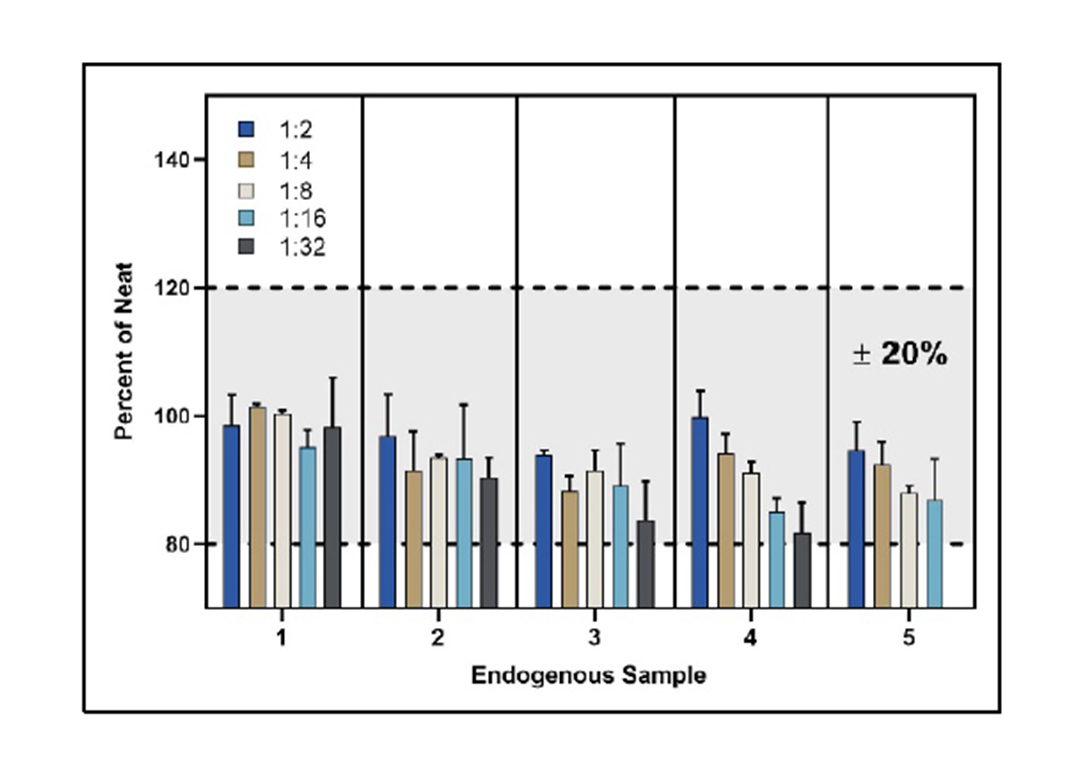
<p>Parallelism of Endogenous Samples (see Technical Data Sheet)</p>

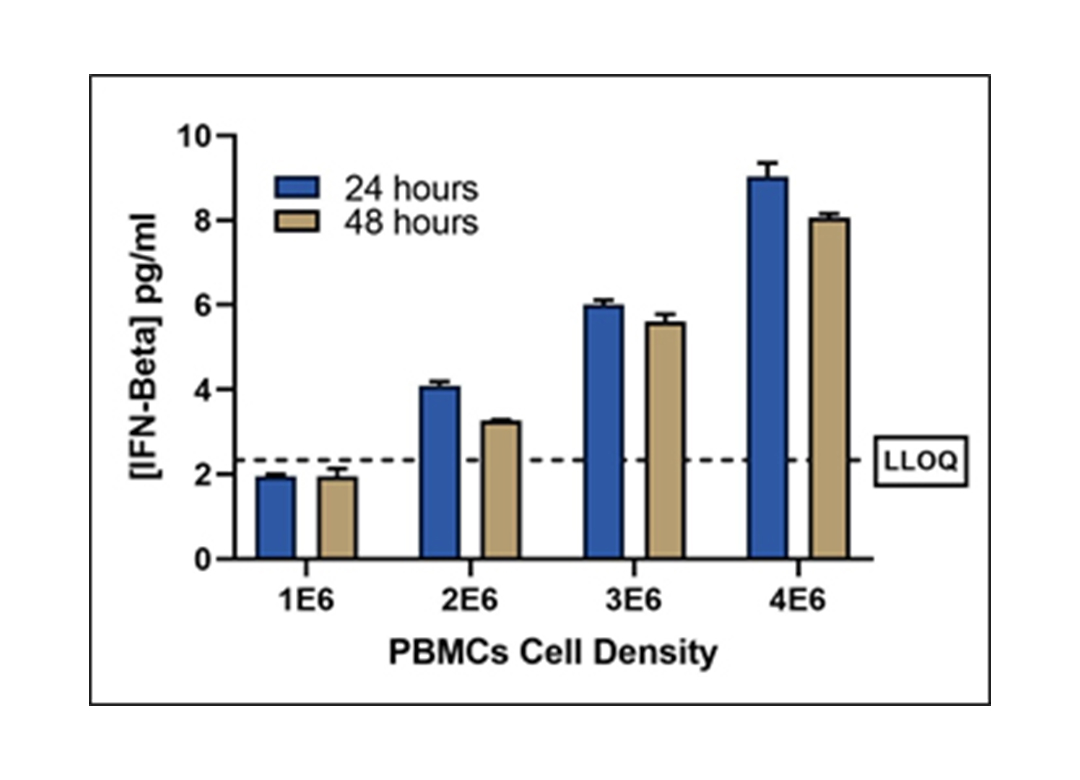
<p>Sensitivity in Stimulated PBMC Samples (see Technical Data Sheet)</p>

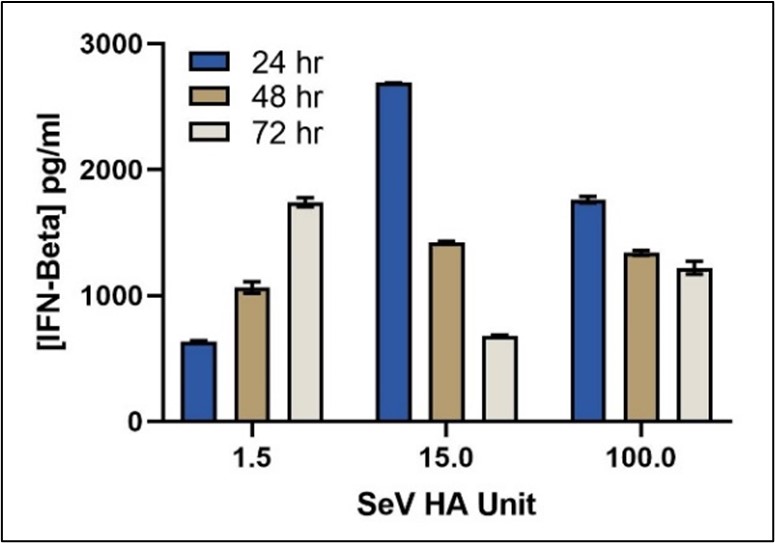
<p>Endogenous Levels of IFN-Beta Quantified in Sendai Virus-Induced HEK293 Cells (see Technical Data Sheet)</p>

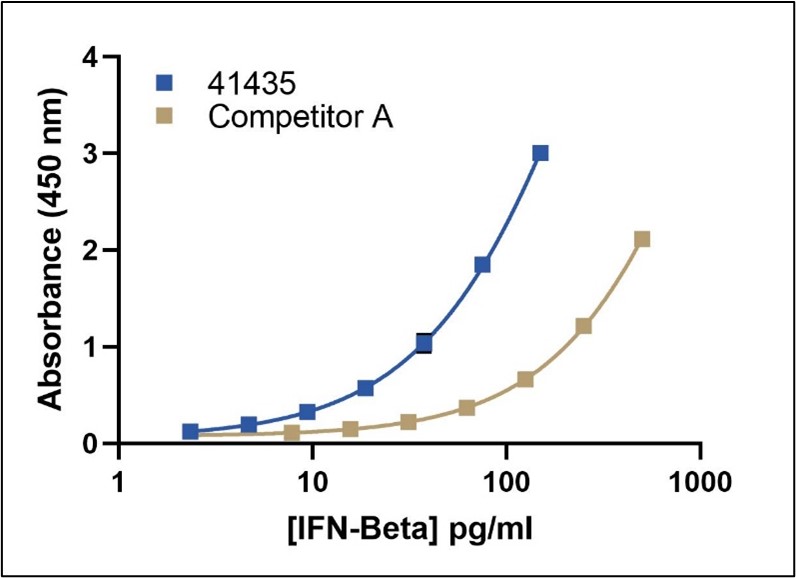
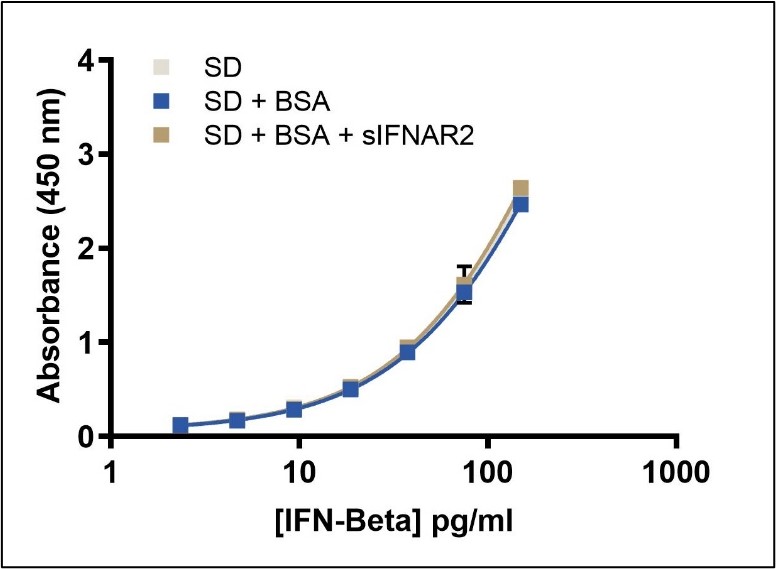
<p>Representative Standard Curves comparison</p>

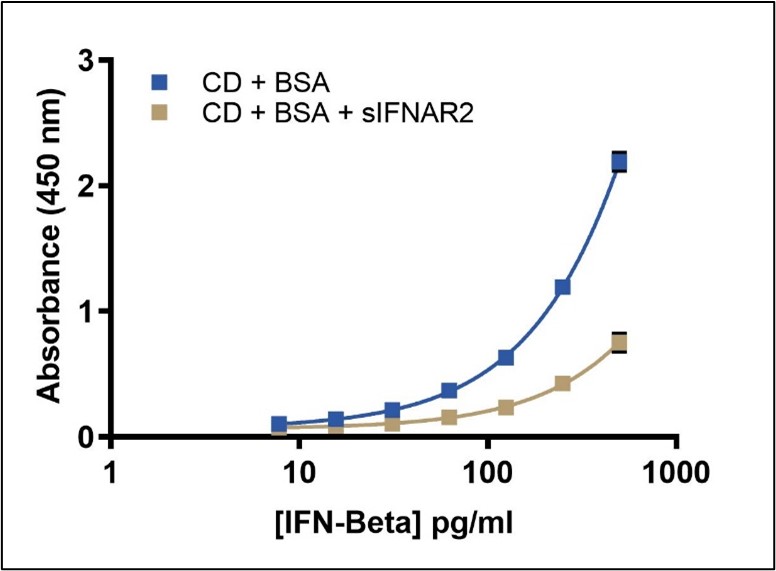
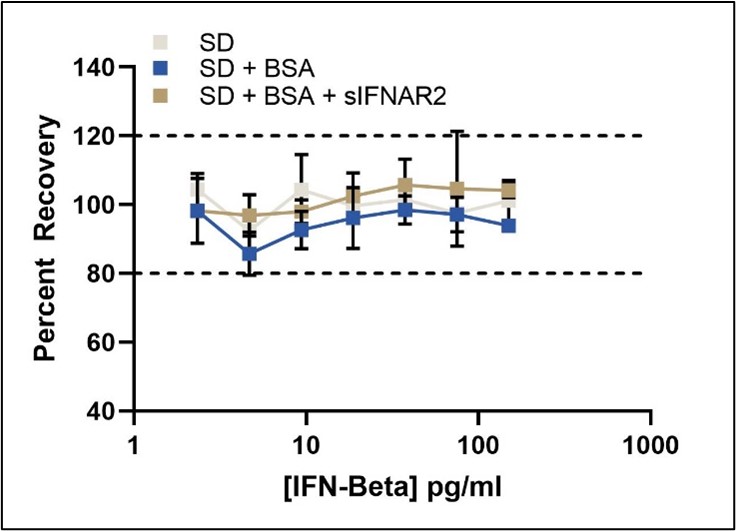
<p>sIFNAR2 Receptor Effect in PBL’s 41435 ELISA (see Technical Data Sheet)</p>

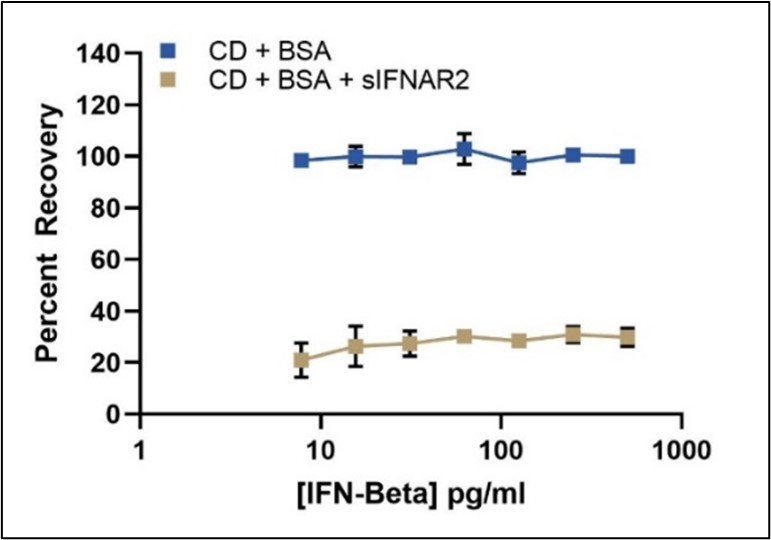
<p>sIFNAR2 Receptor Interference (see Technical Data Sheet)</p>


Human IFN-Beta TCM ELISA, High Sensitivity
Catalog Number: 41435
This ELISA quantitates the amount of IFN-Beta in tissue culture media (TCM) with an LLOQ of 2.34 pg/ml. This kit provides accurate IFN-Beta quantification without interference from soluble IFN receptor (sIFNAR2).
Product Name: VeriKine-HS Human Interferon-Beta TCM ELISA Kit
$545.00
$645.00
Product Info
| Matrix Compatibility | Tissue Culture Media (TCM) only |
|---|---|
| Assay Range | 2.34 - 150 pg/ml |
| LLOQ |
2.34 pg/ml Need more sensitivity? Check out our Sample Testing Services |
| Assay Length | 3 hours |
| Specificity | Human IFN-β |
The VeriKine-HS Human IFN-Beta TCM ELISA Kit is designed for accurate quantification of low-level human interferon beta in buffers or tissue culture media (TCM) by sandwich ELISA. The LLOQ of this kit is 2.34 pg/ml.
Note: This kit is not intended for use with human serum or plasma samples due to a significantly elevated risk of false-positive results.
*For complex biological matrices such as plasma, healthy sera, and disease sera, we recommend our Human IFN-Beta Serum ELISA Kit, High Sensitivity (Cat. No. 41415-1).
Specifications
| CVs | Inter-Assay < 8% Intra-Assay < 10% |
|---|---|
|
Cross-reactivity |
No cross-reactivity detected with:
|
| Synonyms | Human Beta Interferon, Human Fibroblast IFN, Human Type I Interferon Beta, Human IFNb |
| Storage | 2-8ºC |
| Expiration Date | 12 months from the date of manufacture |
| Shipping Condition | Wet Ice |
Materials Provided
- Pre-coated microtiter plate
- Plate Sealers
- Wash Solution Concentrate
- Human IFN Beta 1a Standard, 100,000 pg/ml
- Standard Diluent
- Sample Buffer
- Antibody Concentrate
- HRP Conjugate Concentrate
- Assay Diluent
- TMB Substrate
- Stop Solution
Additional Materials Required (Not Provided)
- Microplate reader capable of reading an OD at a wavelength of 450 nm
- Variable volume microtiter pipettes
- Adjustable multichannel pipette (50-300 μl)
- Reagent reservoirs
- Wash bottle or plate washing system
- Distilled or deionized water
- Serological pipettes (1, 5, 10 or 25 ml)
- Disposable pipette tips (polypropylene)
- Plate shaker
Tech Info & Data
Representative Human IFN-Beta Standard Curves in Various Matrices
Intra and Inter-Assay CVs to measure Precision |
||
| Matrix | Standard Diluent | TCM |
|---|---|---|
| n | 7 | 18 |
| Intra-Assay CV (%) | 4.10 | 4.06 |
| Inter-Assay CV (%) | 2.33 | 3.16 |
Spike Recovery |
|||
| TC Media Spike Sample | 1 | 2 | 3 |
|---|---|---|---|
| Target Conc. (pg/ml) | 100 | 25 | 5 |
| Mean Recovery (%) | 101.1 | 95.7 | 91.4 |
| Range (%) | 97-106 | 90-102 | 85-96 |
Matrix Compliance for Standard Diluent and Three Different TCM
Parallelism of Five Endogenous Samples
Sensitivity in Stimulated PBMC Samples
Endogenous Levels of IFN-Beta Quantified in Sendai Virus-Induced HEK293 Cells
Representative Standard Curves
sIFNAR2 Receptor Interference in Competitor A’s ELISA
sIFNAR2 Receptor Interference in Competitor A’s ELISA
sIFNAR2 Receptor Effect in PBL’s 41435 ELISA
Quantitation of Total IFN-Beta in the presence of sIFNAR2
Background
Interferon Beta (IFN-Beta, IFNb) is synthesized and secreted by fibroblasts and many other cell types in response to varied stimuli in Toll-like receptor (TLR) dependent and independent mechanisms. Pathogen exposure can result in the activation of transcription factors interferon regulatory factor 3 (IRF3) and NF-kB resulting in IFN-Beta production in a stimuli and cell-dependent manner. Conversely, IFN-Beta aberrant expression may be associated with inflammation and autoimmunity.
Citations
4 Citations:
- Luganini, A., et al., (2023), "Mechanisms of antiviral activity of the new hDHODH inhibitor MEDS433 against respiratory syncytial virus replication", Antiviral Res., 105734, PMID: 37852322, DOI: 10.1016/j.antiviral.2023.105734 (link)
- Barnard, T.R. et al., (2023), "Zika virus NS3 and NS5 proteins determine strain-dependent differences in dsRNA accumulation in a host cell type-dependent manner", J Gen Virol., 104(6):001855, PMID: 37289497, DOI: 10.1099/jgv.0.001855 (link)
- Gori Savellini, G. et al., (2023), "SARS-COV-2 omicron sub-lineages differentially modulate interferon response in human lung epithelial cells", Virus Res., 332:199134, PMID: 37192725, DOI: 10.1016/j.virusres.2023.199134 (link)
- Kwart, D. et al., (2022), "Cancer cell-derived type I interferons instruct tumor monocyte polarization", Cell Rep., 41(10):111769, PMID: 36476866, DOI:10.1016/j.celrep.2022.111769 (link)